WaveSense

A 1 kg, 3D-printed smart buoy that measures waves and water quality at the same point, at the same moment.

Move across the water to make ripples

Waves and water quality are usually measured by separate instruments, in separate places. WaveSense measures both from one floating point, every 15 minutes, and flags any number it cannot trust.

Anatomy

Five printed parts. One kilogram.

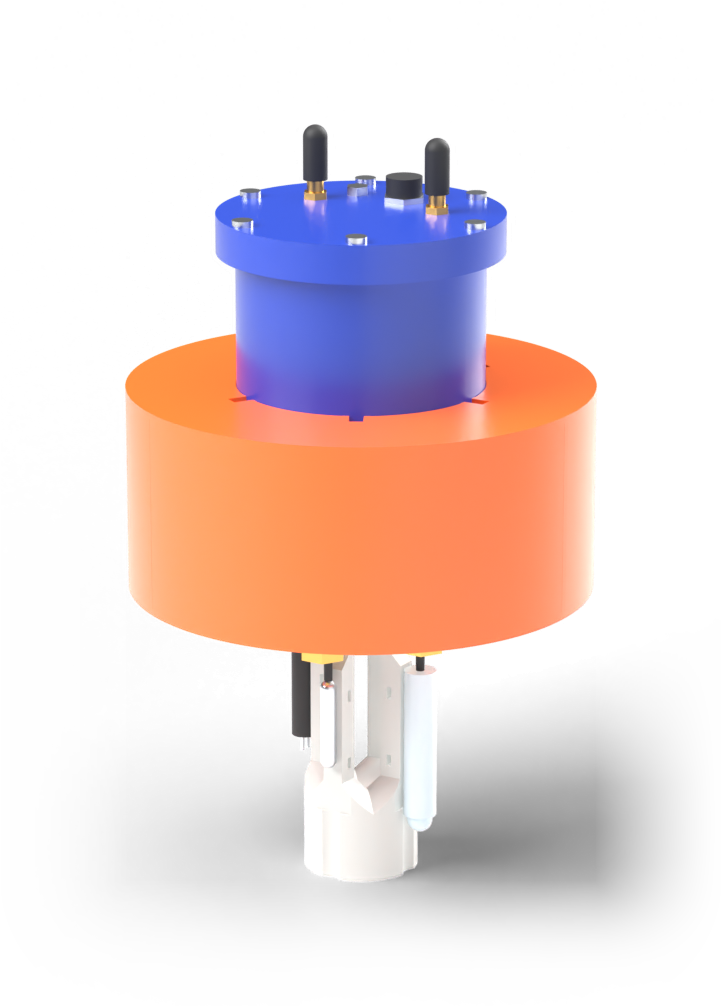
A sealed electronics pod passes straight through a buoyancy collar of six sealed sectors. Below it hangs a keel that carries the wet probes and 113.9 g of lead trim.

  • 1012 g all up
  • Ø170 × 248 mm
  • PETG, 3D printed
1 of 4

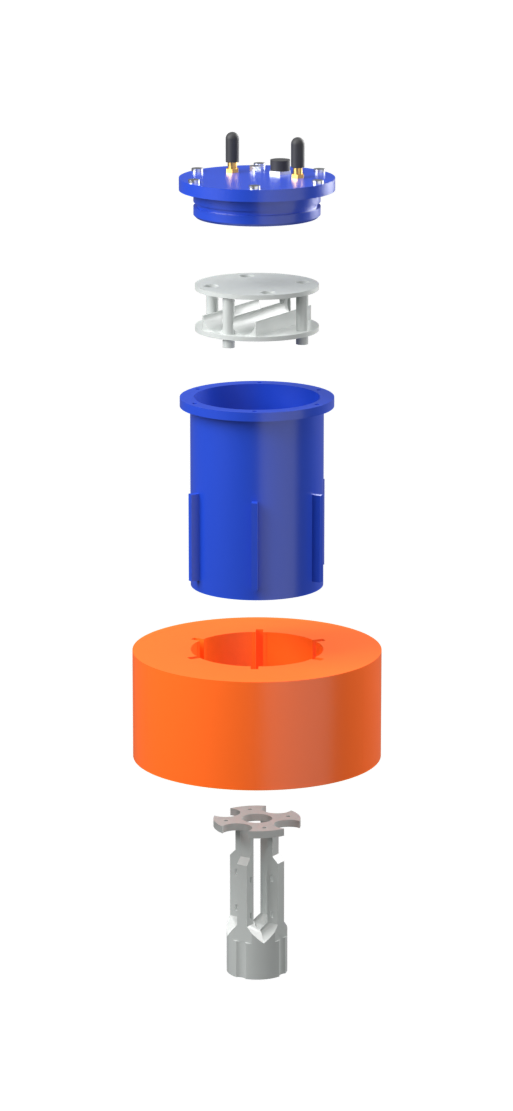
Taken apart, in build order

Keel, collar, pod, electronics stack, lid. Every part is generated from one parameter file, so the CAD, the drawings and the stability sums cannot disagree.

  • 26 printed parts in the project
  • Each checked watertight after export
2 of 4

Inside the pod

The two 18650 cells ride on the stack's base deck, the lowest place clear of the floor's glands and pressure sensor. At 94 g they are the heaviest thing inside the pod, and keeping them low keeps the centre of gravity down. Two card walls and three shelves above them carry every board, the motion sensor on the axis, and a radial O-ring seals the lid. The cells charge through it: the Qi receiver coil sits in the lid, under a 2.4 mm window.

  • 2 × 18650 on the base deck
  • ESP32-S3, SIM7600E-H, NEO-6M
3 of 4

Why it rights itself

Its weight acts at G, 125.8 mm above the bottom of the keel. Tilt the hull and the water's push swings out to the low side, acting up through the metacentre M at 165.2 mm. M sits 39.4 mm above G, so every tilt makes a moment that rolls it back upright.

  • GM +39.4 mm
  • Draft 151.2 mm
  • Freeboard 33.8 mm
4 of 4

Three sectors flooded, still afloat

Hole the collar and a flooded sector simply stops helping. With three of the six full of water the waterline climbs from 151.2 to 172.7 mm, 12.3 mm of freeboard remain, and the metacentric height is still positive.

  • 3 of 6 sectors flooded
  • Freeboard 12.3 mm
  • GM +31.3 mm

Small enough to carry. Built to be trusted.

Every figure here comes out of the same parameter file and analysis code that check the design on every change.

Envelope
Ø170 × 248mm

268 mm to the antenna tips. The pod is Ø90 mm and the collar 75 mm tall; the water comes up to 151.2 mm.

Mass, all up
1012g
Metacentric height
+39.4mm

The metacentre sits above the centre of gravity, so it rights itself from any tilt.

Damage tolerance
3of 6 sectors

Still floats, upright, with half its sealed collar sectors flooded.

Heave period
0.570s

Modelled. Each hull's own value comes from a free-decay test: push it down 30 mm, let go, fit the ring-down.

Sampling
50Hz

8192 samples in 164 s, every 15 minutes, timed by a hardware timer on a processor core of its own.

Endurance
3.8days

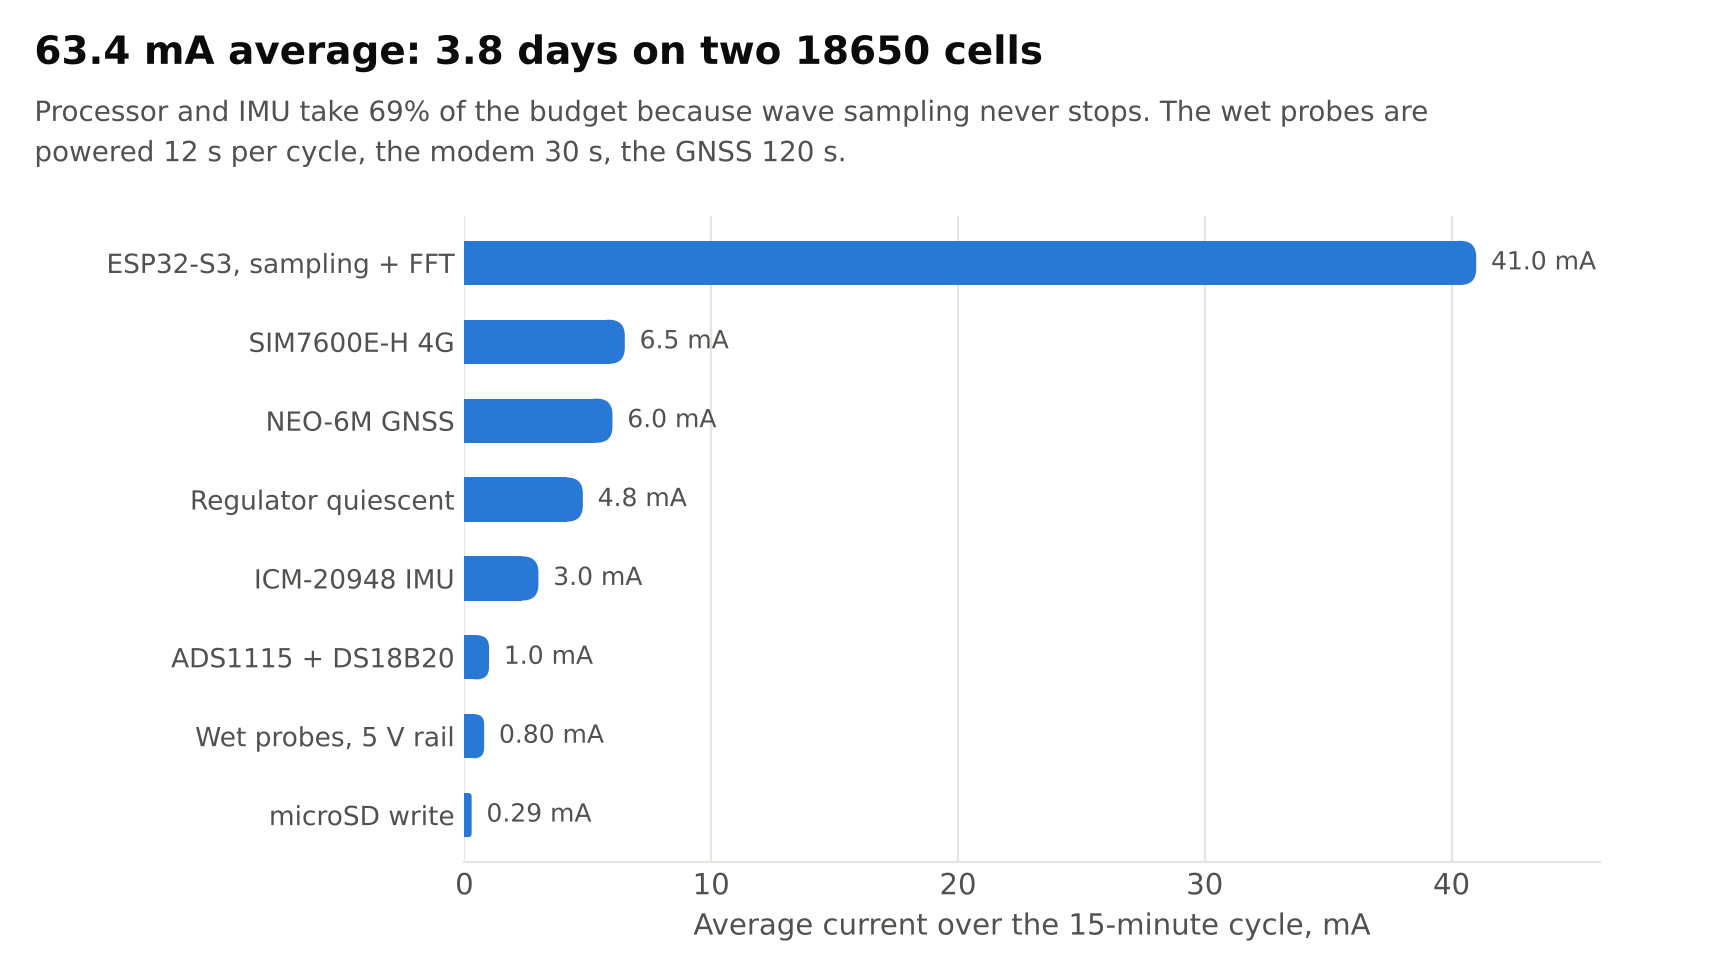
63.4 mA on average from two 18650 cells.

First unit, all in
Rs 34,017

Rs 22,572 of it is the buoy's hardware, below; the rest is spares, printing, shipping, three field trips and a 12 % contingency.

Data
microSD, then 4G

Every burst is written to the card first, and that file is the dataset. Then an HMAC-signed upload goes out over 4G to the WaveSense server, with its quality flags and confidence interval attached, and on to the app.

Same electronics. Two ways to read the water.

Floating free in a river

The buoy rides the waves. Its accelerometer feels every heave, and the pipeline on board turns that acceleration into a wave spectrum, corrected by the hull's own measured response.

  • Wave height, peak and mean periods, energy, energy flux, mean direction and spread
  • The probes sample the water the waves are stirring

How a moving buoy measures a wave

This is the buoy's own method, running in your browser with the same steps and constants as the code on board. Change the sea and watch it measure.

River waves in 3 m of water. The hull follows them almost exactly, so the correction changes little.

  1. Sample vertical acceleration at 50 Hz for 164 s.
  2. Filter down to 5 Hz, then estimate the spectrum from 256-sample Welch segments.
  3. Divide by (2πf)⁴: two exact integrations, with no drift.
  4. Divide by the hull's heave response, measured on each hull by a free-decay test.
  5. Keep the band where signal beats sensor noise, then read Hm0 and Tp.
The sea and the buoyt 0 s
What the accelerometer feelsm/s²
The spectrum it computes from this one burstm²/Hz
Measured Hm00.250 m
True Hs0.250 m
Error0.0 %
Peak period3.00 s

The buoy reports a 90 % confidence interval with every burst.

Why not integrate twice in time?

Because a tiny offset in the accelerometer grows with the square of time. A bias of 0.01 m/s² integrates into 18 m of false displacement in one minute. In the frequency domain that bias lands at zero frequency, where it is simply thrown away, and each integration becomes an exact division.

The same burst, integrated twice in time0.0 m after 60 s

The water the waves are stirring

Waves lift sediment off the bed, and turbidity follows wave energy. Measuring both at the same point and the same moment is the reason this buoy exists.

Pb Schematic: heights to scale, widths 1.5 times. The probes on the near and far sides are drawn either side of the axis.
  • pHA glass electrode, calibrated at three points. The console refuses any electrode below 85 % of the ideal Nernst slope.
  • TurbidityAn optical head, calibrated at two points against formazin. The reading to watch beside wave height.
  • Conductivity, TDS, salinityOne probe, read by the 16-bit ADC, and powered only while it is being read.
  • Water temperatureA DS18B20. Every pH and conductivity reading is corrected with it; uncorrected, conductivity reads about 2 % high per °C.
  • Depth, and a leak alarmAn MS5837 pressure sensor in the pod floor. 100 g of water inside would add 5 mm of draft, 25 times what the sensor can resolve, so a leak shows up before it does damage.

The wet probes are powered for 12 s in every 15-minute cycle. That saves energy, and it keeps the pH and TDS electrodes from polarising, which they do when left energised in water.

Verified, one burst at a time

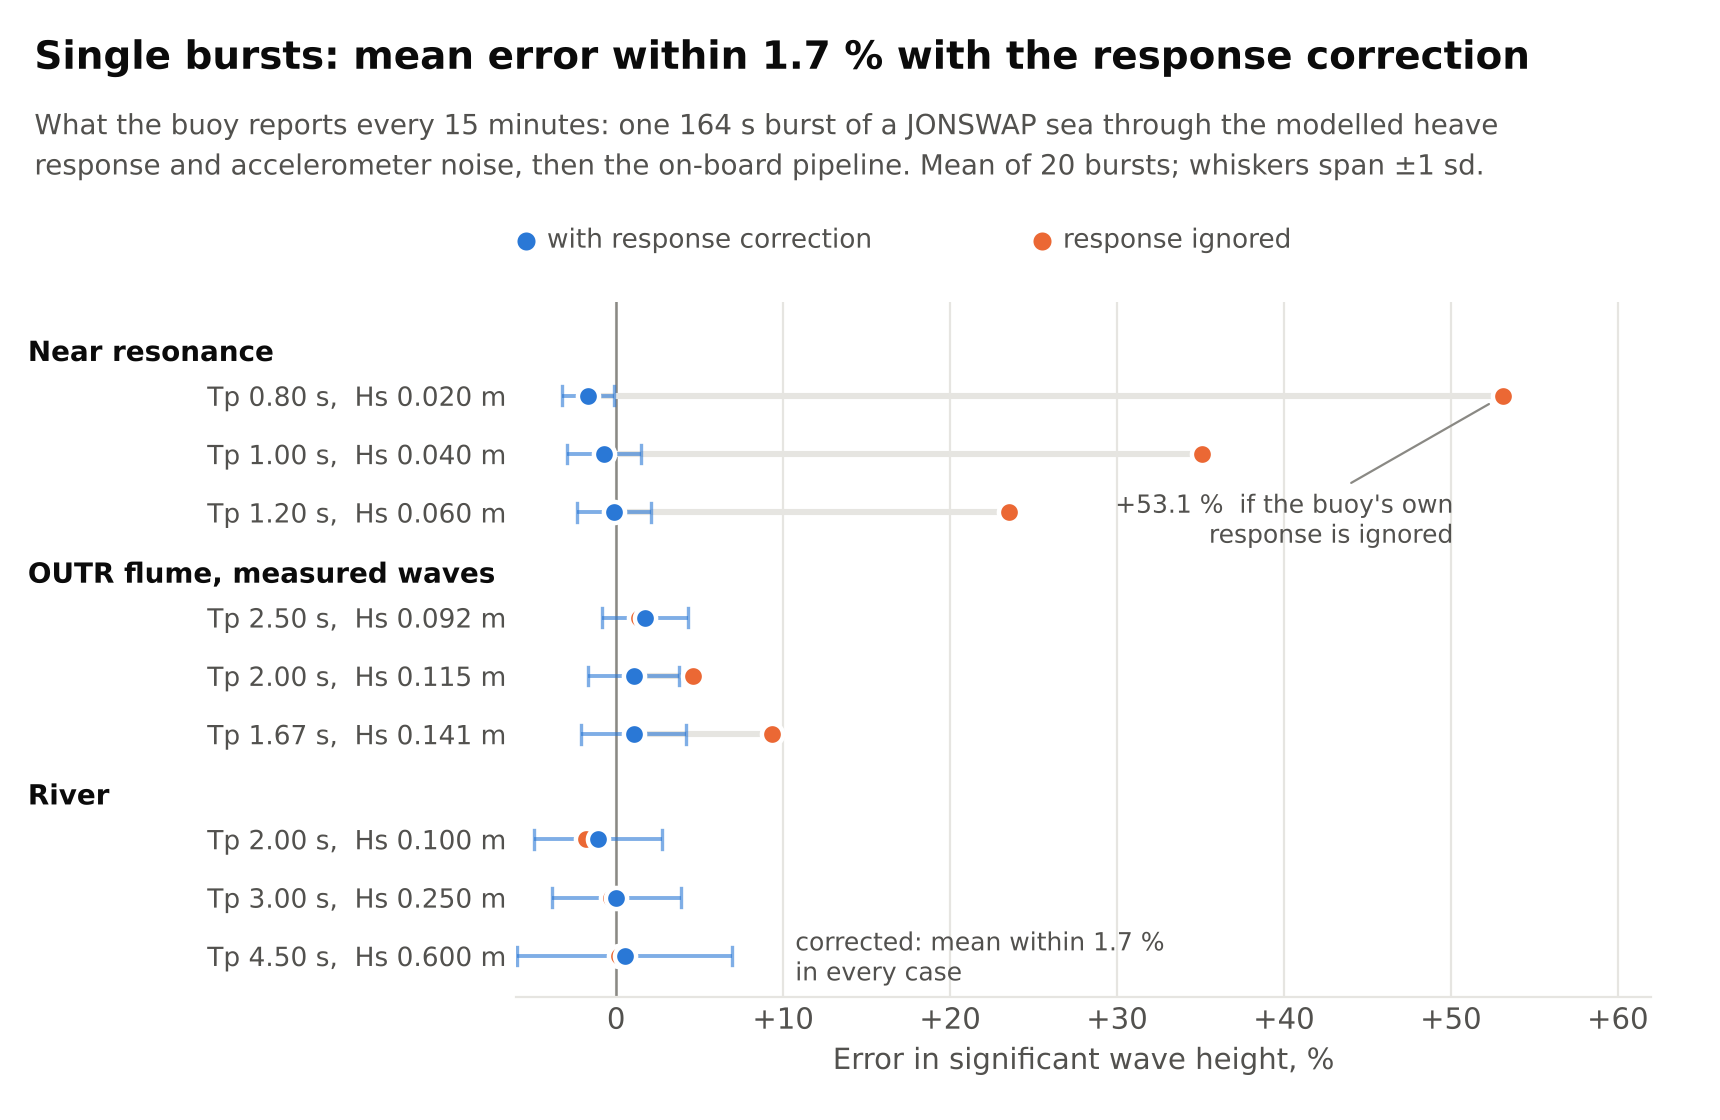
Each chart is drawn from numbers the analysis code computes, and the code reruns on every change. The buoy itself has not been in water yet; these are simulations at the conditions measured in the test flume.

On a single 164 s burst, the mean error stays within 1.7 %

Wave-height error for nine simulated seas, each the mean of 20 bursts, with the whisker spanning one standard deviation. Without the hull-response correction the buoy reads up to 53 % high near its own resonance.

With the response correctionResponse ignored
Dot plot of wave height error on single bursts for nine simulated sea states, within 1.7 % with the response correction

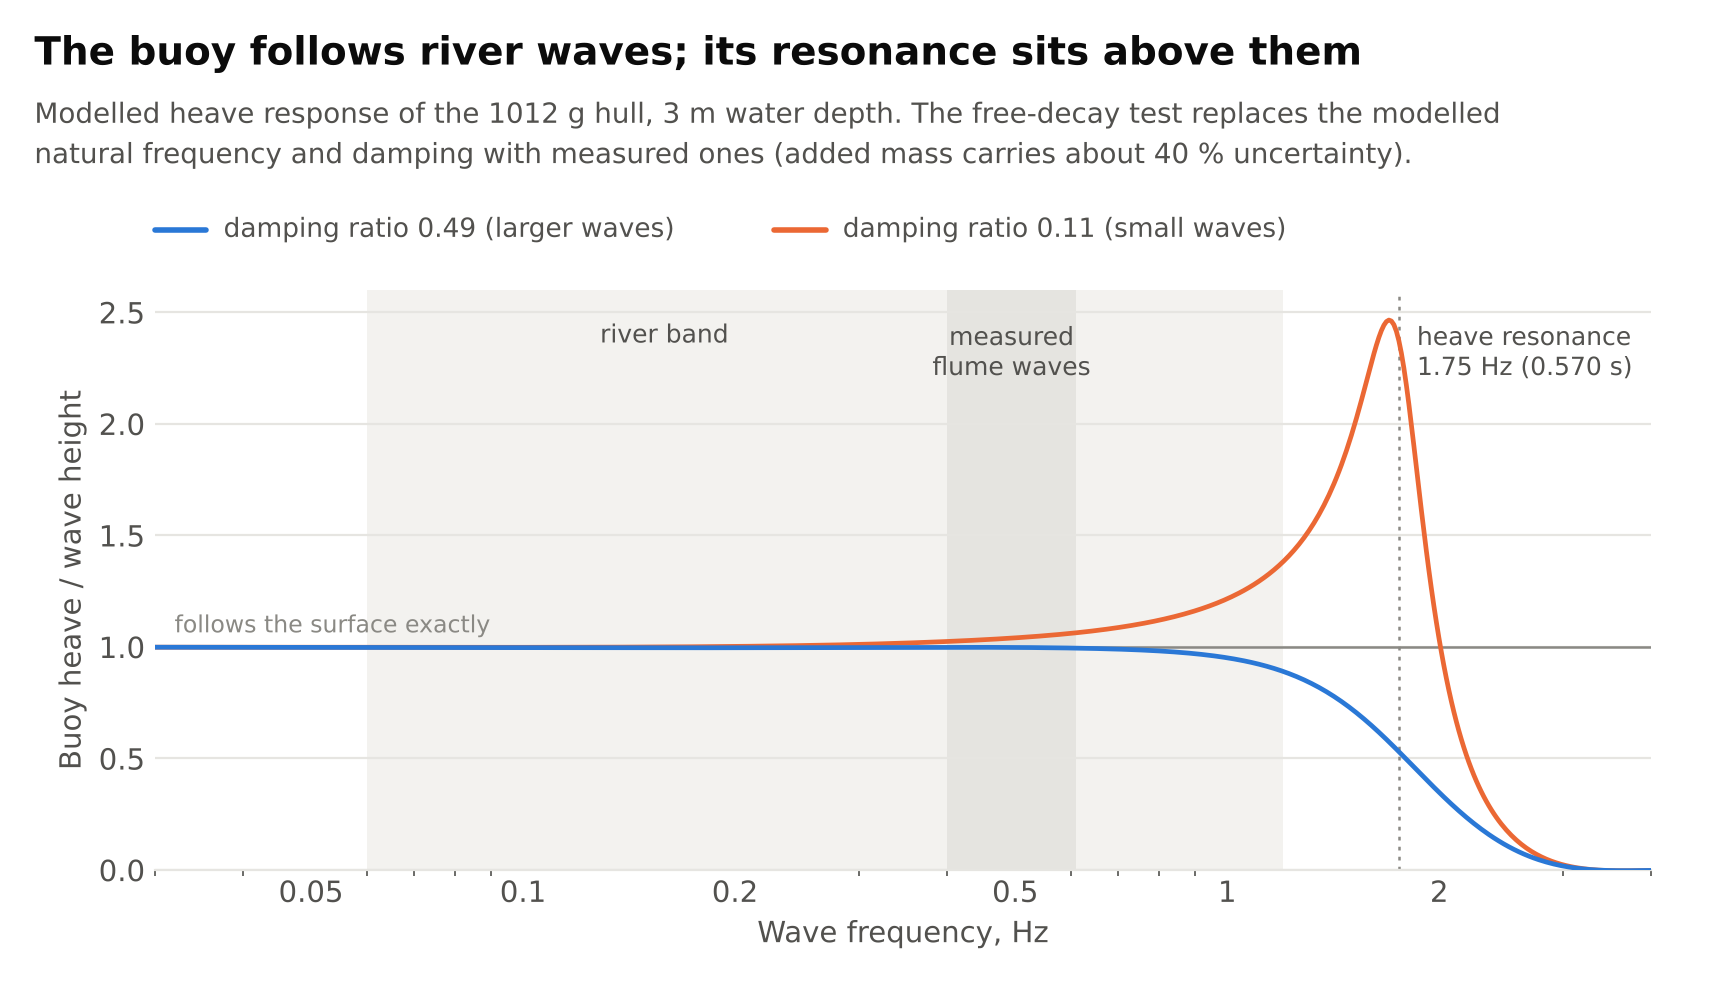
The hull follows river waves

Heave response against wave frequency. The hull resonates at 1.75 Hz, above the river band; damping sets how high the peak climbs, and the free-decay test measures it.

0.49
Heave response of the hull against frequency

63.4 mA on average: 3.8 days on two cells

Wave sampling never stops, so the processor takes most of the budget. Everything else sleeps between bursts.

Average current by load
$ python3 run_all.py --native
  1. okparameter set
  2. okfirmware header
  3. okhydrostatics + RAO
  4. okdesign closure
  5. okpower budget
  6. okwave pipeline
  7. okfirmware parity
  8. okfirmware syntax
  9. okstaff driver, host
  10. okBluetooth protocol, host
  11. okfree-decay fitter
  12. okCAD, all parts
  13. okflume kit fit checks
  14. okkeel fit checks
  15. oklid and charging checks
  16. okfit-out checks
  17. ok3D views B-1..B-21
  18. okdrawings B-5..B-13, B-26
  19. okschematics B-6..B-9
  20. okflume drawings B-22..B-25
  21. okfit-out drawings B-27, B-28
  22. okREADME figures
  23. okwebsite assets
23 of 23 checks pass, on every push.

Measured, not assumed. The OUTR flume the buoy will be tested in was characterised from 20 archived reference-gauge records: still-water depth 0.350 m, wave periods 1.64 to 2.50 s. That is intermediate water, where neither the shallow-water nor the deep-water shortcut holds, so the analysis uses the exact finite-depth relation throughout.

Every file, in one folder

The drawings, the print files, the source and the design record are private. An access code from the team opens them for viewing here; to download them too, sign in with Google and ask. The privacy page says what signing in shares.

Locked

The files are in the project's Google Drive. Ask for access there with your Google account; the team approves it.

    From parameters to the river

    1. Every printed part rebuilt from one parameter fileRevision (a): pod, lid, collar, keel and tray, regenerated and checked after export.
    2. The test flume measured, not assumedTwenty archived records give its real depth and wave periods; the analysis now runs at those conditions.
    3. Collar sectors sealed for realRevision (b): keyways lined so each of the six sectors holds its own air.
    4. A ballast cup in the keelRevision (c): the lead is potted after the float test, with no pause in the print.
    5. Flume kit and carriage mountRevisions (d) and (e): a two-rod wave staff, lid ports, and a drilling jig for lids already printed.
    6. Single-burst accuracy fixedLonger spectral segments: the mean error is now within 1.7 % on single bursts, with a flag for a spectrum piled against the edge of the band.
    7. Charging through the lidRevision (g): the Qi receiver gets a pocket under a 2.4 mm window, the antenna and connector ports move aside to leave it clear of metal, and a printed cap holds the transmitter over it.
    8. The appAndroid, iPhone and iPad, Mac and Windows: the results from anywhere through the server, and the buoy itself on site over Bluetooth. Everyone signs in; each buoy's owner decides who sees it and who runs it.
    9. Everything inside the podRevision (h): an electronics stack that stands on the keel bosses and leaves every probe cable a way up, a keeper and keel tabs that hold the collar, and jacking screws for the lid.
    10. Print and float testsSeal, sector leaks, draft, self-righting and the free-decay test.
    11. Electronics bench tests and probe calibration
    12. Flume comparison against a reference wave gauge
    13. River deployment

    Built by four students at OUTR

    Civil Engineering, School of Infrastructure and Planning, Odisha University of Technology and Research, Bhubaneswar.

    • Soumyajit Khatua
    • Sampurna Biswal
    • Rituraj Jena
    • Satyapriya Senapati

    Guided by Dr. Siprarani Pradhan, Assistant Professor, OUTR.

    HYDRO 2026, IIT IndoreAbstract accepted.
    Best Presentation Award, HYDRO 2025For the team's IoT wave-monitoring module, the work WaveSense builds on. NIT Rourkela.

    Get in touch: Soumyajit Khatua on LinkedIn